

We are starting week #14, Interface and application programming. For this week the idea is to program an application that can works as an interface, receiving and sending data to and from my xiao ESP32-S3. Well, as usual, let´s hope for the best and see what is up for this week. We are almost done with this journey and i'm feeling really tired.
This week assignmets are:
Group assignments:
Individual assignments:
| Components/Software |
|
| Description components | |
|---|---|
 |
Is a diminutive development boards, sharing a similar hardware structure, where the size is literally thumb-sized. Integrates camera sensor, digital microphone and SD card supporting. Combining embedded ML computing power and photography capability, this development board can be your great tool to get started with intelligent voice and vision AI. Data from: Xiao ESP32S3 |
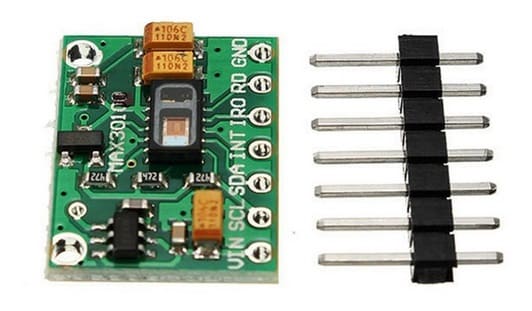 |
Is an integrated pulse oximetry and heart-rate monitor module. It includes internal LEDs, photodetectors, optical elements, and low-noise electronics
with ambient light rejection. It provides a complete system solution to ease the design-in process for mobile and wearable devices.
Data from: Max30102 |

is the perfect environment for makers, students, and researchers interested in testing, learning or teaching IoT. Join thousands of users from around the world in making the future data-driven. provides a secure and easy way to build IoT solutions for students, makers and researchers. It is used for sending data from any Internet-enabled device to the cloud, triggering actions and alerts based on that data, and visualizing it.
Features:
Data from: Ubidots
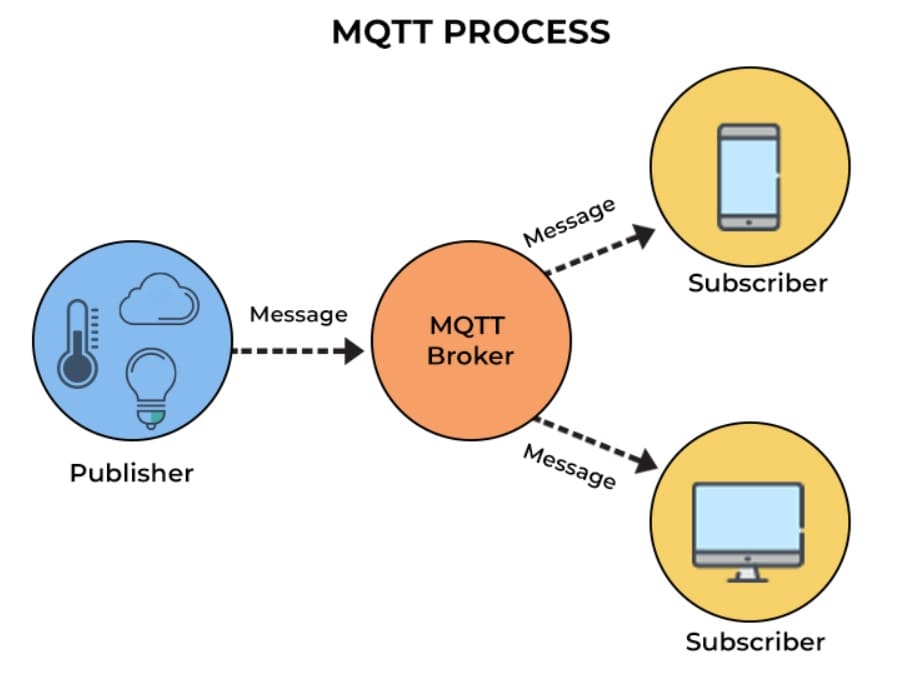
is an OASIS standard messaging protocol for the Internet of Things (IoT). It is designed as an extremely lightweight publish/subscribe messaging transport that is ideal for connecting remote devices with a small code footprint and minimal network bandwidth. MQTT today is used in a wide variety of industries, such as automotive, manufacturing, telecommunications, oil and gas, etc.
Features:
Data from: MQTT
I first focus on the individual assignment and then this section. So in the individual assignments I use MQTT protocol which I think is very useful and ubidots to make a Dashboard to capture the max30102 sensor measurements in real time. Now, for this part i'm using python to make a screen and show a graph of the measurements of the max30102 sensor.
For this code I use chatgpt. But I have to made some changes and I had to specify detail information to generate a good result. I'm going to explain part of the code and show the changes I made:
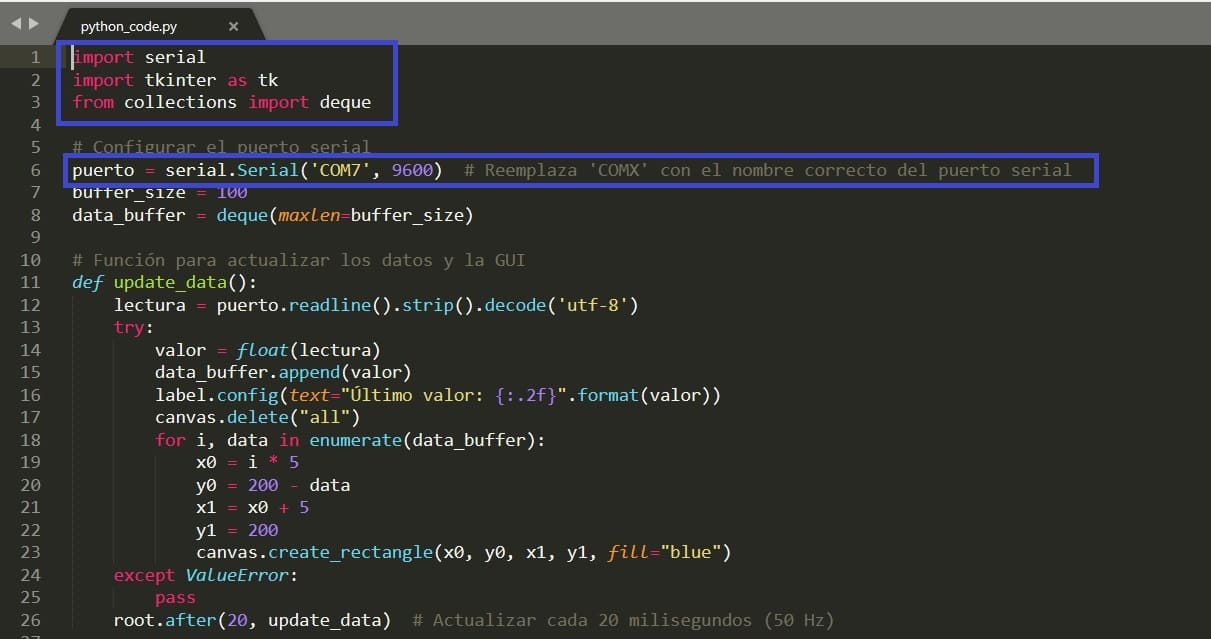
In the second part of the code:

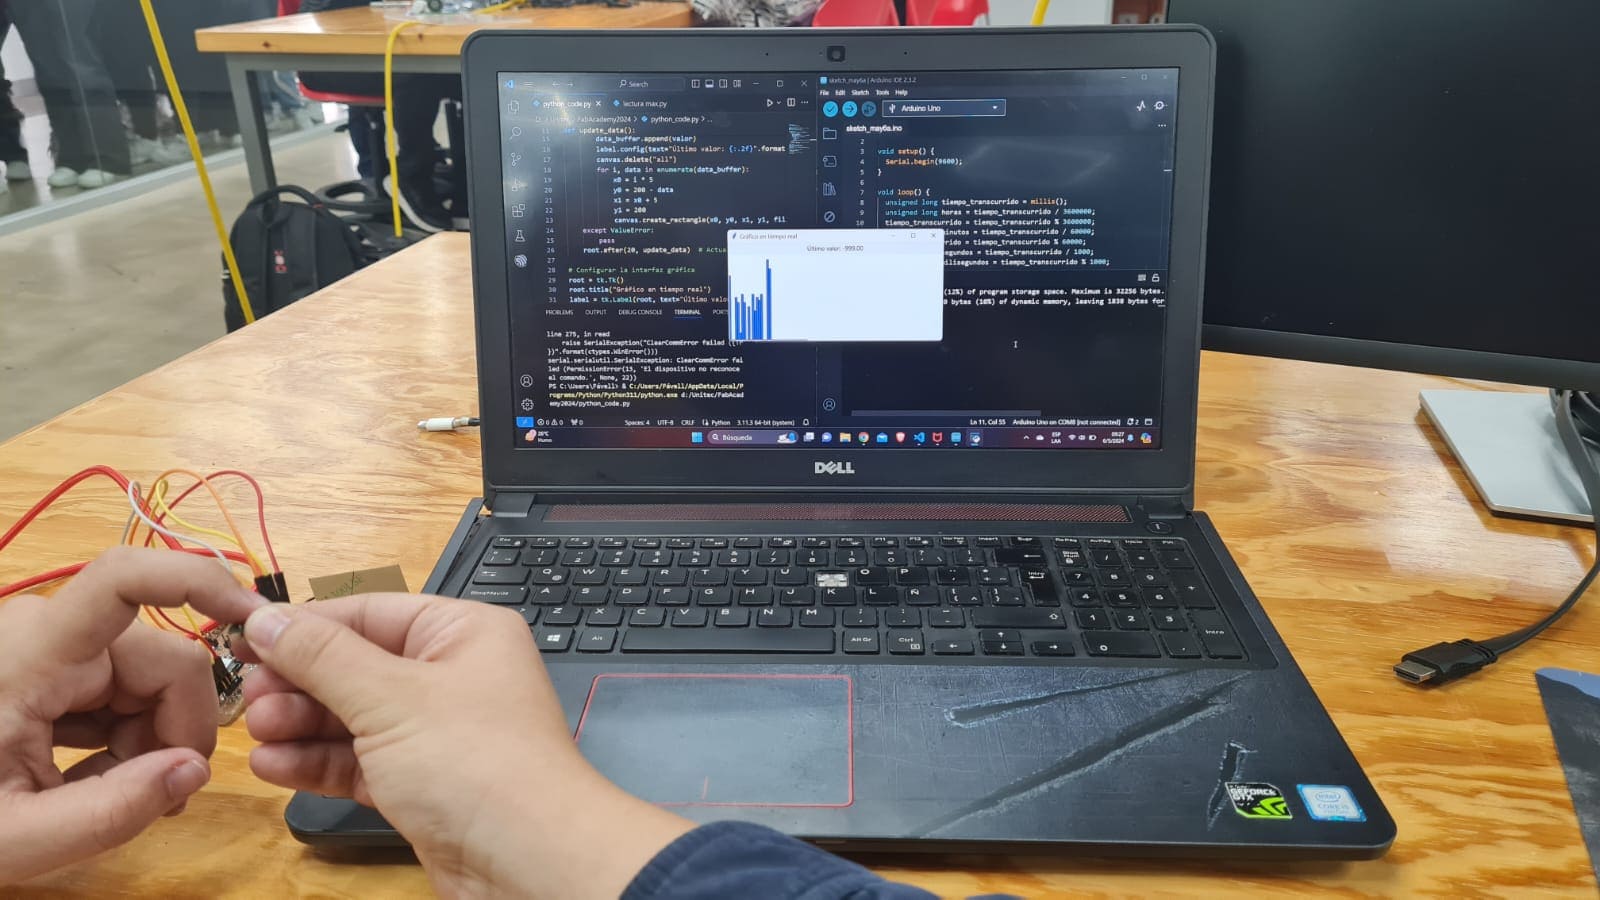
In the next part i'm sharing two videos of the results I got from the coding in python. Just to explain a little bit, the measurement I took was the heart beats and:
In this part of the assignments I decide to use MQTT. The idea is that I have is to capture the information from my Max30102 sensor, which by the way i'm using for my final project, so "two birds". The information is the heart beats and the SPO2 in the oxygen. By doing this I can monitor the data from the web if I have the link. So lets give it a try.
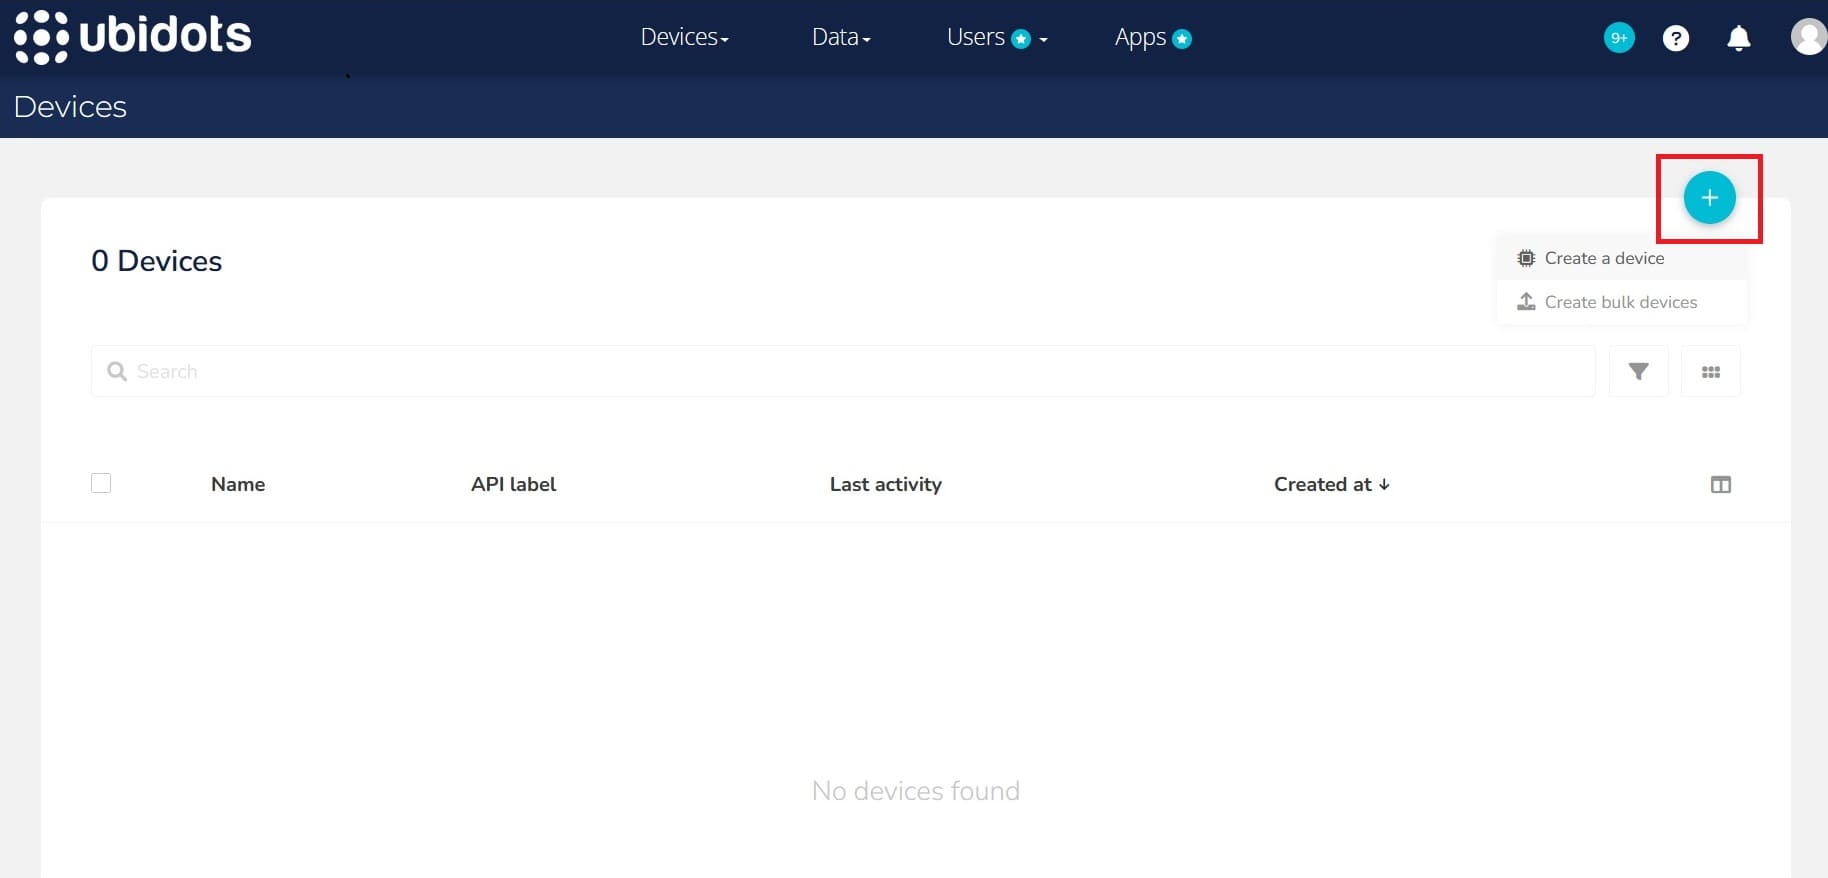
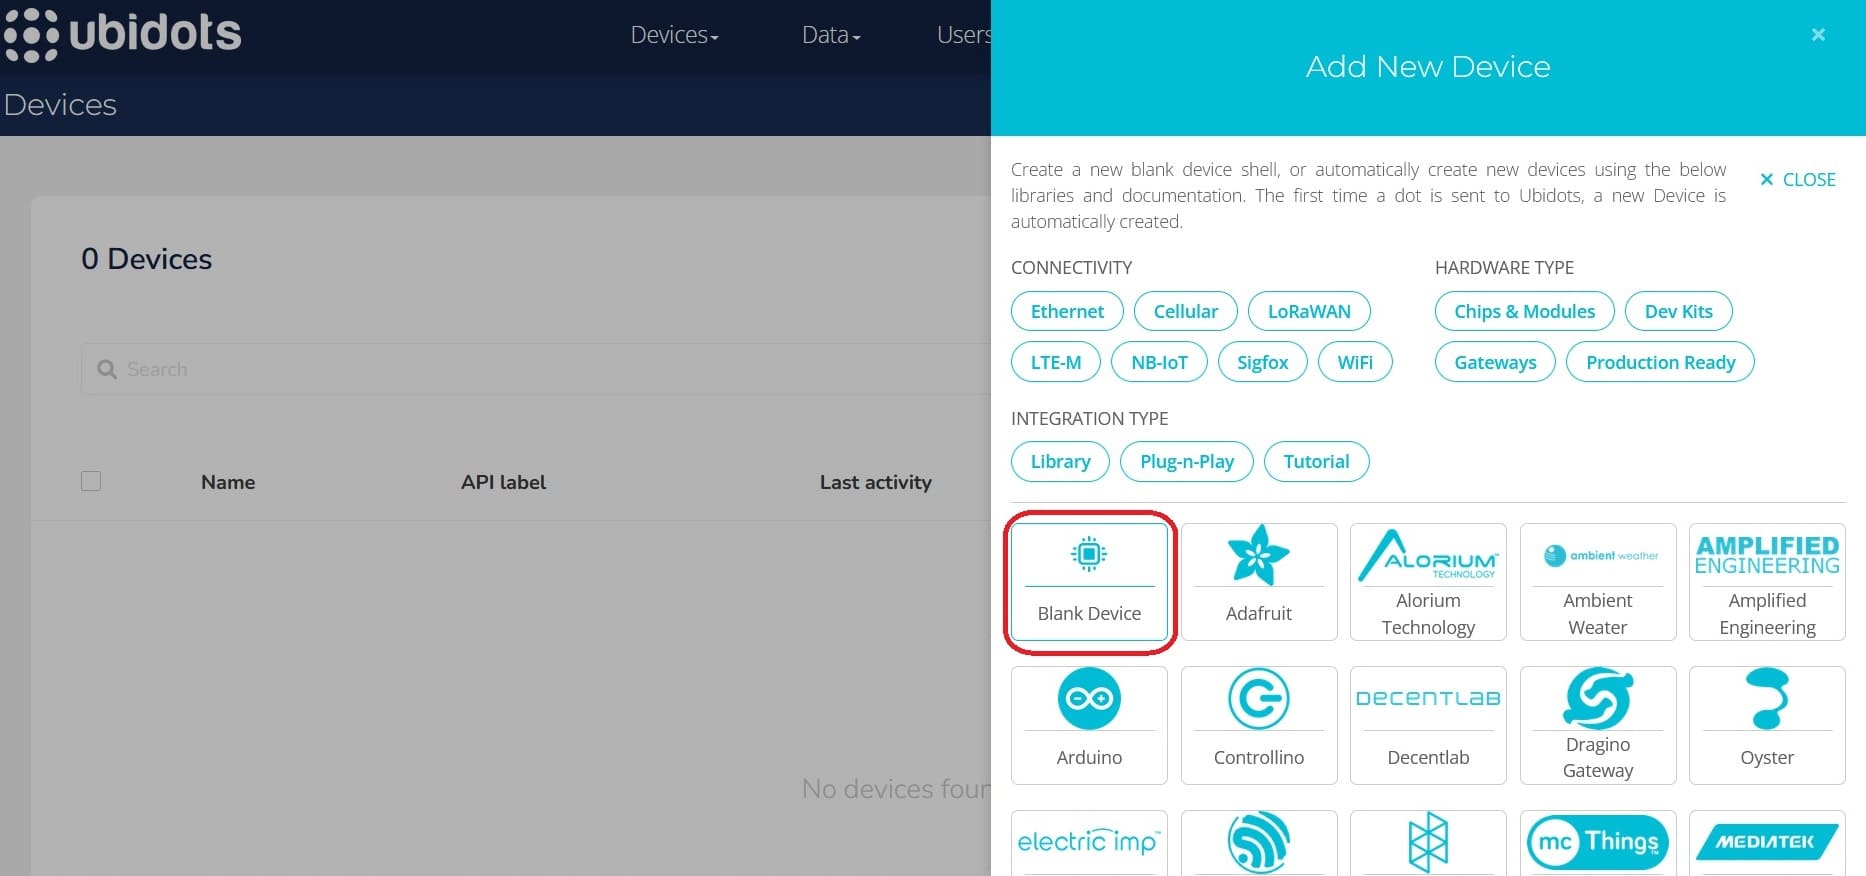
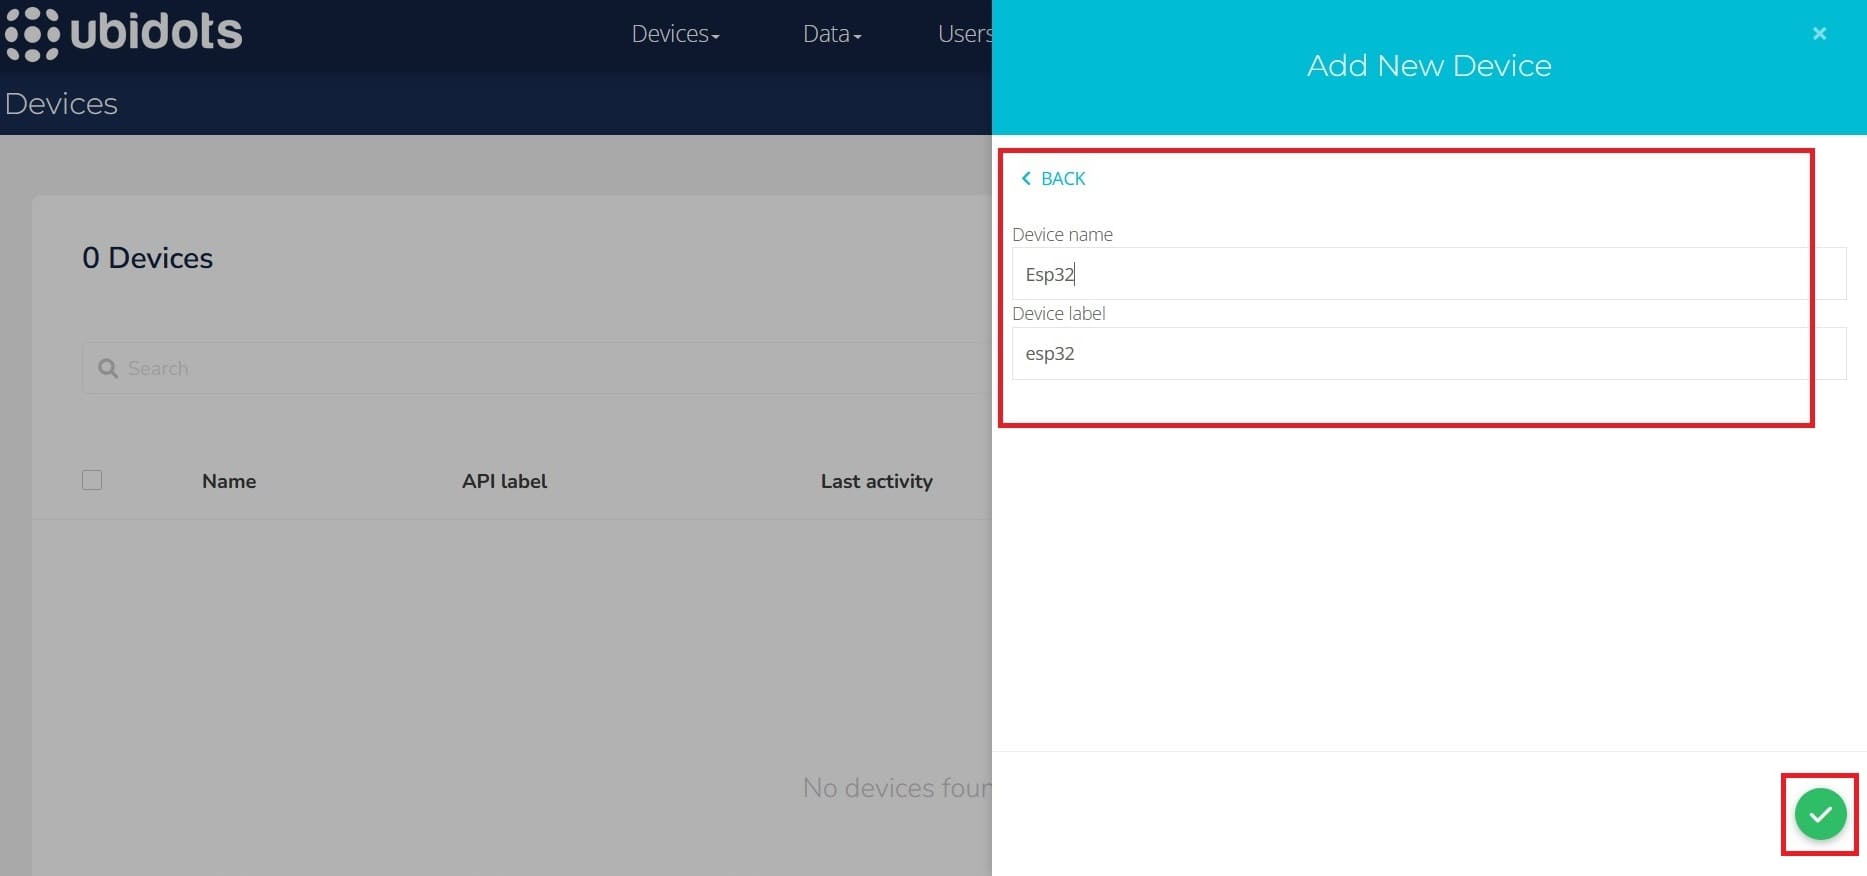

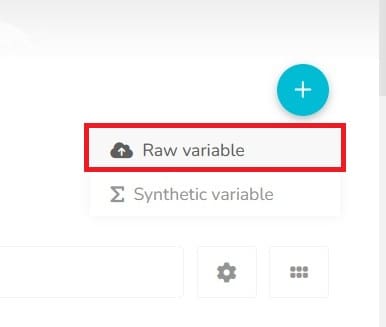
In this images you can see the two variables I just created. And I make a test, just make a little program that reads two variables. One of them is adding +1 to 0 and the other one substracts -1 to 100 every second. Below i'm going to explain how to make the connection between my code and ubdots project we created.
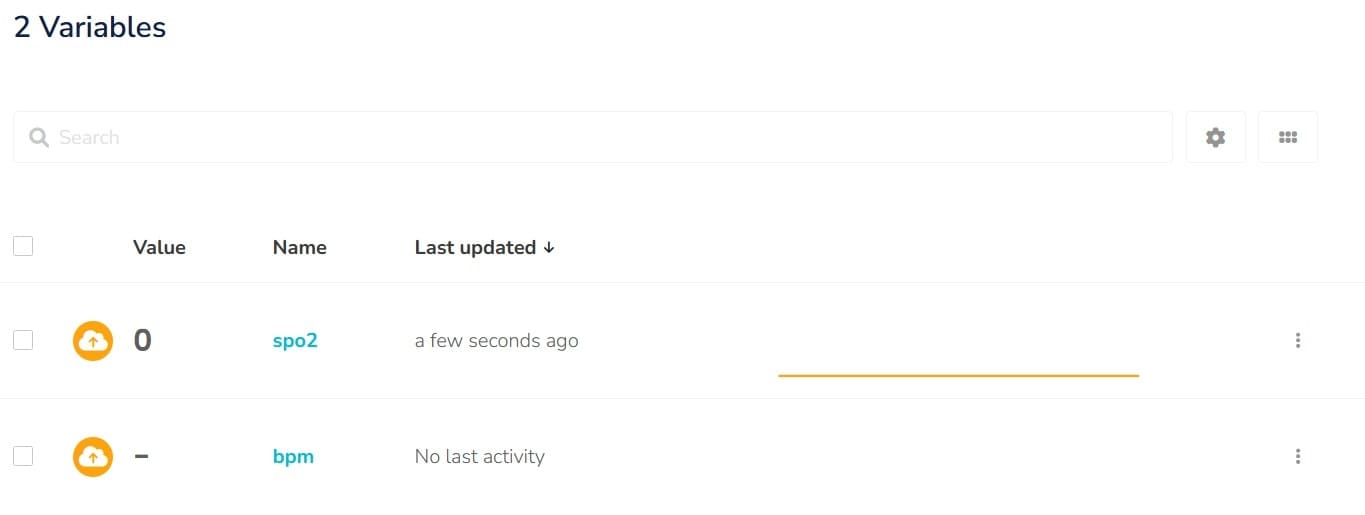

Now that we have created the variables. We proceed to create a Dashboard, this way we can a have a nicer way to look the measures of the Max30102.
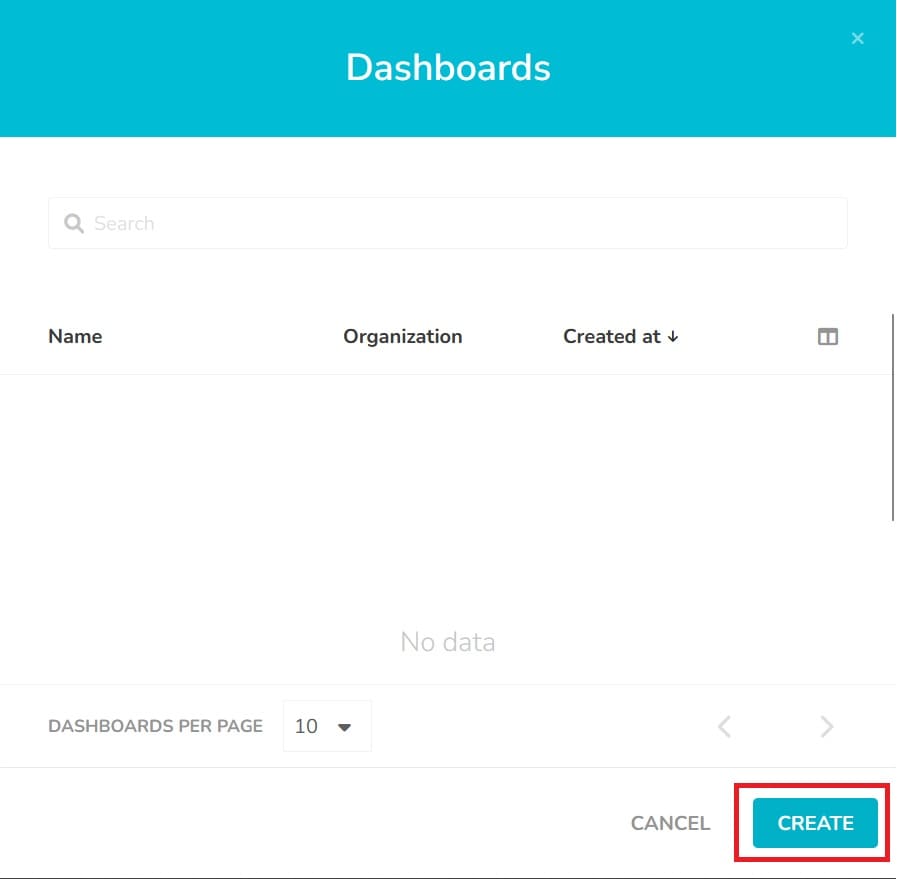
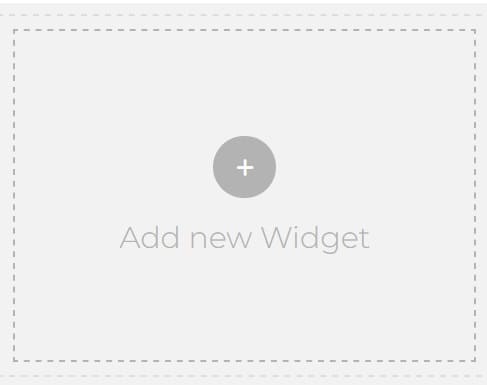
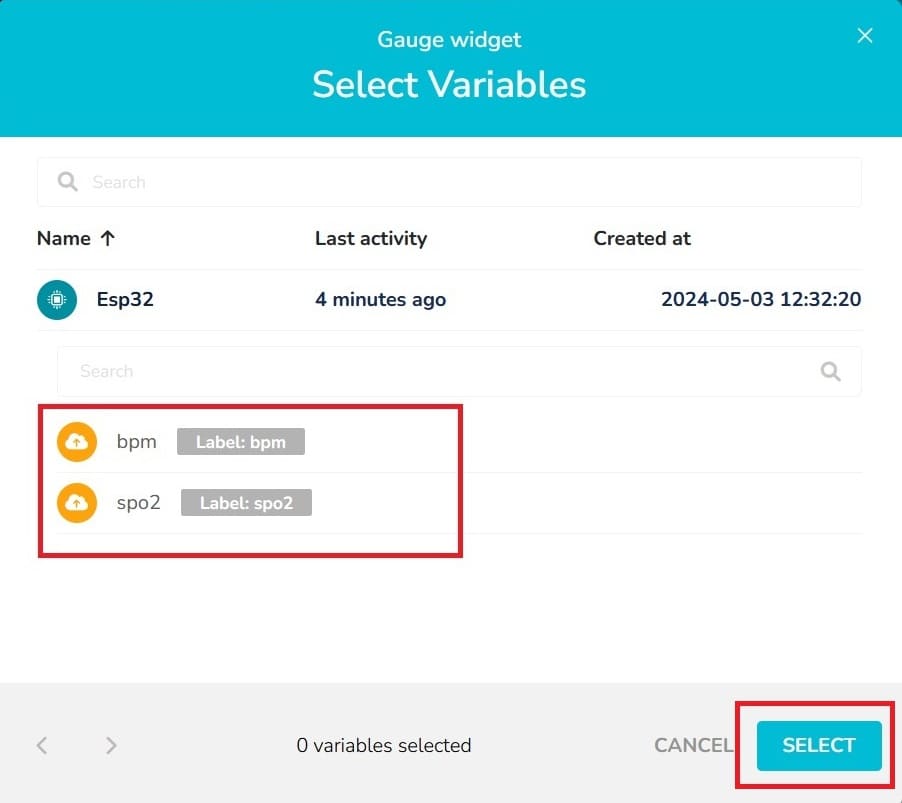
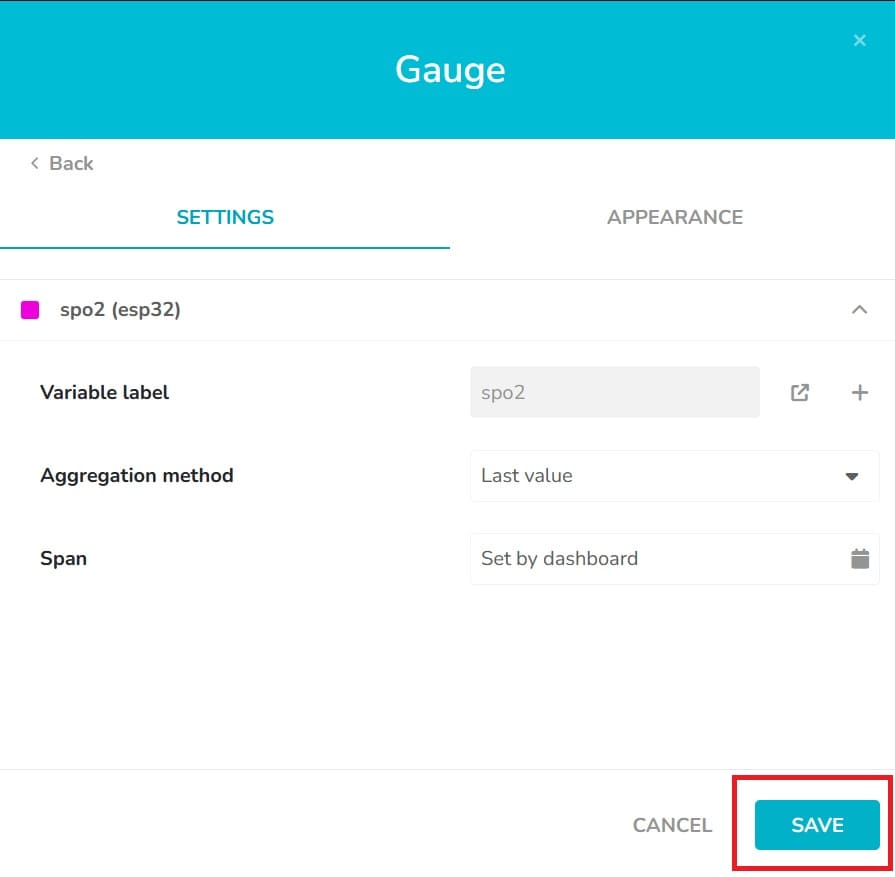
So, while we create the dashboard by selecting the widgets we have lots of options. This doesn't that we are going to use we each ever we want. It got to be appropriate widgets. For example, in my case I chose:
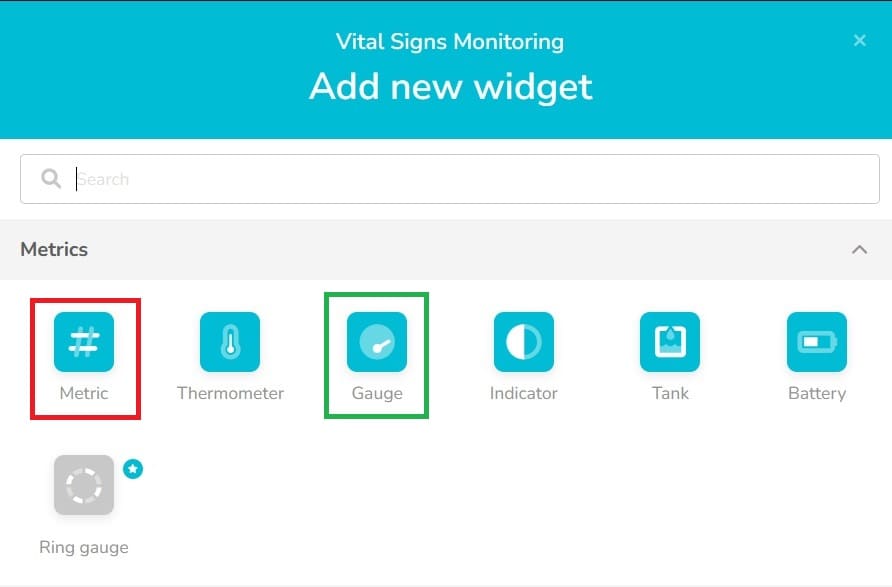
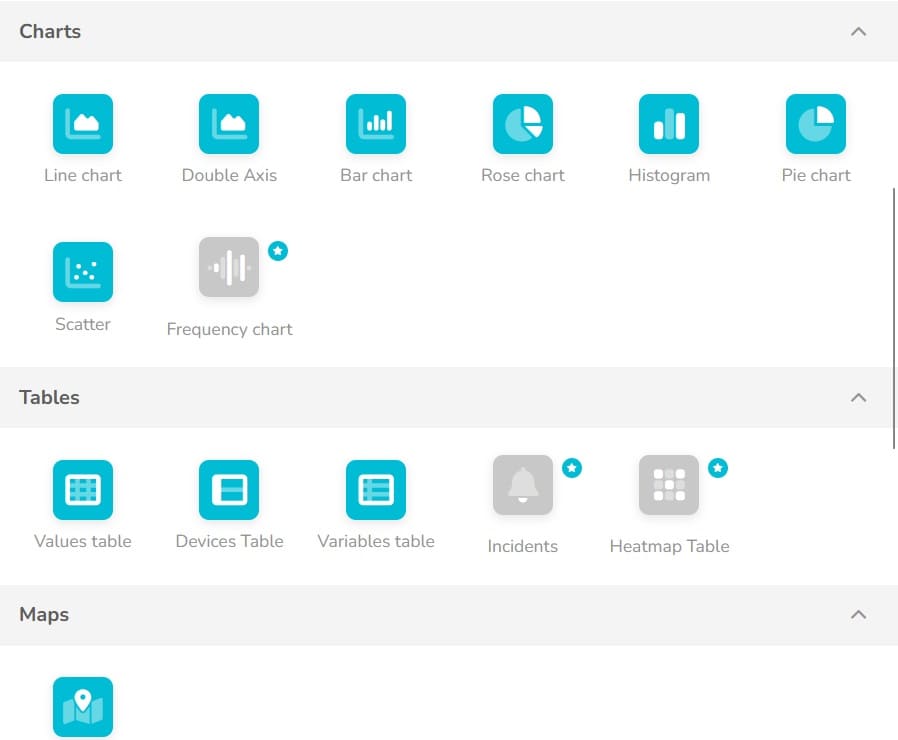
In this part i'll try to explain what I did to connect my device using MQTT protocol. I'm going to show the code I'm using and explain it:
Lets begin:
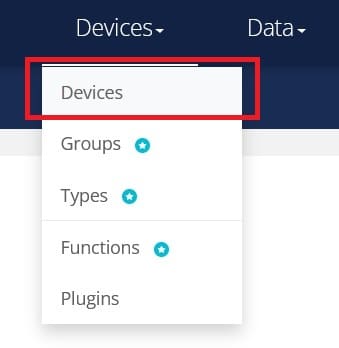


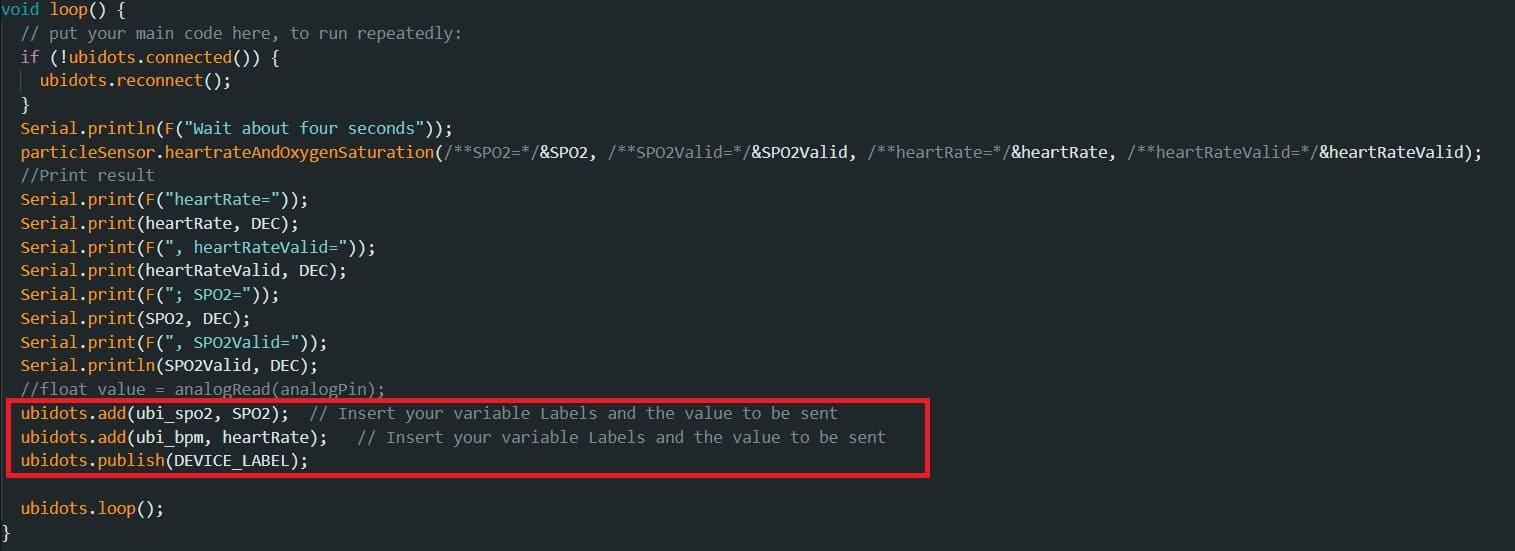
In this next section I'm sharing with you some 3 videos I took of the final result. En each video you can see the measurements of the max30102 sensor in real time . With this now I can monitor the results of the measurements just by having the the link yo my dashboard.
I had problems with the wi-fi networks. First of all the networks here at the university are very restrictive. So I decided to:
What did I learn in this week?